Search

Custom Search

Wednesday, June 10, 2009

Universe tutorial # 1


Overview:

This is a fast training on how to create and design SAP business objects XI universe. To build a universe you can use the designer tool or the universe builder tool, both of them is a totally independent tool. In this short tutorial I will use the designer tool to build a small universe. I will write another separate post to describe how to use universe builder and what is the deference between universe builder and designer tool.

You can also visit the following BO Infoview tutorial(s) first:

Before you begin:

I assume that

  • You have installed business objects client on your machine.
  • You have an access to business object server.
  • You have the required permission to create universe and all type of objects.

Login:

  • Click on start menu.
  • Go to this path: start --> All Programs --> Business Objects XI Release 2 --> Business Objects Enterprise --> Designer.
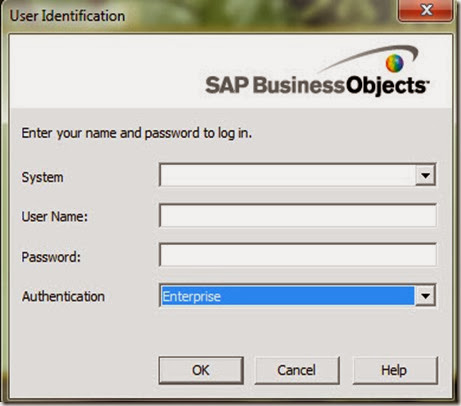
  • Enter system, user name, password and authentication: Enterprise (by default)

Login Screen

Create new universe wizard:

  • When you login in to the first time the create wizard will start automatically and the welcome screen will displayed.

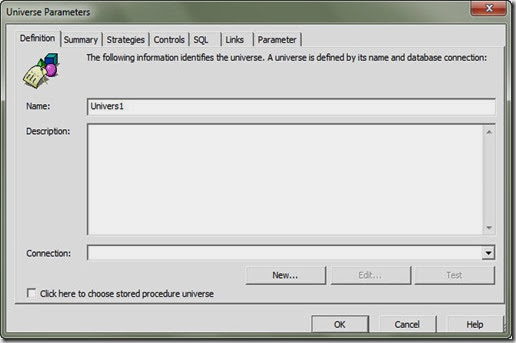
Click begin and then in the "define universe parameters" screen enter the following

  • Universe Name: Ejada
  • Connection: create a new connection of use an already exists one.
  • In the "create initial classes and objects" screen start by select tables form the left pan and add them by clicking the add button to the right pan. You even can select a specific column. Just expand the + beside table and select column or multiple by holding the CTRL button while you selecting.
  • In the "Create measure objects" start selecting your measure column (column that contains numbers and you will not use it in aggregation, like profit, cost, balance etc.) and the function that you want to apply to that measure (count, sum, max, min etc.)
  • In the congratulation screen click finish.
  • Note: you can just cancel the wizard and do all this steps manually.

Universe Parameters Definition

Note(s):

  • There are 3 types of connection:
    • Personal
    • shared
    • secured.
  • There are many connection type. you can connect to different types of databases [Oracle – Teradata – DB2 – MYSQL..etc]
  • There are many native connection types to other SAP products like SAP Strategy management & SAP ERP.

Connection # 1

For detail information about the following related subjects click on the link beside:

Tool interface description:

After define the universe name and connection you should be ready to start working in your model. The universe designer interface can be categorized into 3 main panels.

Physical Panel: Here you will create your data foundation model by adding tables. Then create the required joins. create alias & derived tables as per your need. There are some advanced topics related to context & loops that we will talk in details about in another post.

Business Model: This is the right panel as shown in the figure below. This should be the end result that will be displayed to the end user. the end user should be able to drag the required objects from this panel and the query behind will be generated automatically so the end user should not worry anymore about technical staff. the objects names should be business wise and in business term and you need also to add description to make your business model more user friendly . 

Tool bars area: This should contains icons to access many functionalities and features provided by SAP BO universe designer.

10-22-2013 4-14-10 PM


Physical Layer [Data Foundation]:

Insert new Table:


After finishing the wizard you can add any tables that you want to use in this universe. Let's say that we want to add some lookups tables (tables contains descriptions for some cods stored in the fact table)

  • Right click anywhere in the designer windows in the area that contains the previously added table. [You can also do the same from the insert menu]
  • Select insert Tables… from the drop down menu.
  • Navigate to the required schema & a list with all tables names in your database will be displayed, just select a table and click on the insert button.
  • Click refresh button if you don't see the table that you want. This may happen if the tables added while you just open the insert table window.

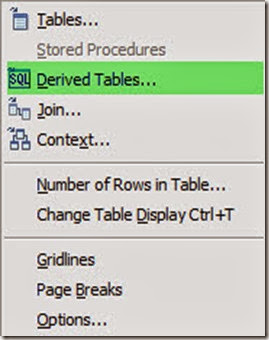
Derived table Rclick

Notes:

  • In BO XI 3 you can only build the universe linked to one connection. IN BO R4 you can include tables from different source system in same universe.
  • As a work around to overcome and address the limitation described in the previous point you can use the database link.

Joins:

To insert a join you may just drag a column from the first table and drop it on the referenced column in the target table. A black line will join between the 2 columns. Double click on this black line and the join window will open:

  • Table1: primary table with the key column.
  • Table2: secondary table with the referenced column.
  • Operation: operation that will be used in join (example: table1.user_id = table2.user_id)
  • Cardinality: use the detect button to detect the join cardinality or set it manually. (1- many, many-1, many – many)
  • If you need to specify an outer join just select the box under the table that you want to outer join.
  • For complex joins use the expression text area below.

Notes:

  • Take care from loops and resolve it before you finalize your physical layer development.
  • Take care from the following traps and fix them before you move forward:
    • Fan trap.
    • Chasm trap.
  • You need to start looking fro context after you complete your joins.


Derived table:

To create a derived table, right click in the designer window and select derived tables from the drop down menu.

  • Derived table name: type the descriptive name for your derived table.
  • Type the SQL select statement that will define you derived table
  • Click on check syntax button and close.
  • A new table with the specified columns in the select statement will be displayed in the table's area in the designer window.

For more information about derived table click here


Business Model:

In business model you define your objects and group them in a meaningful folders (Classes). You may also create condition which will act like a pre-defined filters ready to be used by end user in their reports and on the fly analysis. There are 4 types of the objects that you can create in the business model:

  • Dimensions:
  • Measures
  • Detail
  • Condition.

Class:

class is a business grouping of some objects. Class act like a folder & To create a new class click on the insert class button from the tool bar or select insert-->class. Then type the class name and description.

Dimension:

Dimensions are the angle that you can look at the date from. Most likely it will be string or date type. like Region, Product, Customer sector …etc. to create a dimension Select the class that you want to create the dimension in:

  • Name: dimension name
  • Type: character, number, date, long text.
  • Description: write description for this dimension.
  • Select: select the column that associated with that dimension. May be also being complex and having some logic.
  • Where: type the filter that you want to use while displaying this dimension.

Measure:

Measure is a number represent the value, amount, volume, rate or benchmark data. to create a measure you need to identify the following

  • Name: name for the measure.
  • Function: function that will be used when aggregating (sum, count, max, min)
  • Select: data base column or any calculated numeric value.

For more information about measure database aggregation and report level aggregation click here


Condition:

Condition is a pre-defined filter ready to be used by the end user by drag and drop in their Webi report to filter or restrict the data based on business rule.

  • Name: condition name.
  • Condition: expression that define the condition.

For more details about per-defined filters check this link [Conditions (Pre-defined filters) in SAP BO]

Sunday, June 7, 2009

@prompt:


Description:
Use this function to prompt user for a value will be used during report run. For example if you want to run a monthly report against a specific month, you have to prompt the user to enter the Month or even select it from the list of value displayed.


Before we start:
I assume that you are familiar with BO universe designer and BO web inelegance. If you need to go through universe or Webi rich client tutorial please use the following links:
Syntax:
@prompt ('prompt text (1)', 'type (2)', 'list of values(3)', 'mono/multi(4)', 'free/constrained(5)')


Parameters:
Param Description Mandatory Values
1 Text used to prompt the user when he trying to run/refresh the report Yes N/A
2 Type of the expected value entered by the user and also must be same type of the object that we will use the prompt return value to compare with Yes A: alphanumeric
C: string
D: Date
N: Number
U: Unicode
3 List of values that will displayed to the user if he click on the Values button when he prompted to enter a value No Object defined to retrieve list of values
4 Number of valued allowed No Mono: user can select one value only
Multi: user can select Multi Values
5 User can edit enter a value by himself or not. No Free: user can type his own value
Constrained: user must select from list of values.


Where to use this function:
You can use this function anywhere; this is some places that you can use this function
  • Filter: you can use this function to prompt the user for a value that will use in filtering the retrieved data. [Click here for more information about conditions & Pre-defined filters in BO]
  • Where clause: when you create an object you can use this function in the where clause.
  • Select clause: you can use this function even in the select clause see examples.
  • Derived table: you can use this function in your derived table query. [Click here for more information about how to use prompt with derived tables]


Tips and Tricks:
  • You can use the same prompt in more than one place; just make sure that the prompt text exactly the same when you use it with other universe objects.
  • You can use data conversion function to convert the prompt returned value before using it. For example if the prompt return "Jan09" and you want to compare it with a Date column in database you have to convert it before using it. In our case we will use to_date (@prompt(,,,,,),'MONYY').
  • If your prompt will return multi value use IN operation instead of equal (=)
  • Note that not all users having permission to view list of values while they trying to run or refresh the report by default. The administrator should grant this permission to this user.
  • If you will use the free mode (user can type what he want) you should give a hint in the prompt text message about the data format expected. For example if the user should enter month in format (MON YY) then the prompt message should be descriptive like "Please enter month like Jan 09".


Example # 1 (simple prompt):
We need to create a new condition that will prompt user to enter a valid date to display data related to this date in our report.
Create a new condition with the specification below [Insert --> Condition]
  • Name: As of Date prompt
  • Description: Prompt user to enter a specified as of date value
  • Where:

    @select(Dimensions/As of Date) = @prompt (
    'Enter As of Date:', 'D', ['Dimensions/As of Date'], mono, constrained)
Notes:
  • Red single quote places. It will give you error message "Parse failed: invalid definition UNV0023"


Example # 2 (Prompt returns multi values):
We need to create a new condition that will prompt user to select cities that he wants to display revenue data
Create a new condition with the specification below [Insert --> Condition]
  • Name: Cities prompt
  • Description: Prompt user to select one or multiple cities to filter data according to
  • Where:

    @select(Dimensions/City) IN @prompt (
    'Select one or more cities from the list:', 'C', ['Dimensions/City'], Multi, constrained)
Notes:
  • We used Multi key word instead of mono this time this to indicate that the prompt will return one or more values.
  • Note also we used the IN operator instead of equal. This is because the return value is a collection of values not one single value as the previous example.


Example # 3 (user type Free Prompt):
We need to create a new condition that will prompt user to type the city that he want to display report data for.
Create a new condition with the specification below [Insert --> Condition]
  • Name: City prompt
  • Description: Prompt user to select or type a city
  • Where:

    @select(Dimensions/City) = @prompt (
    'Type a City name:', 'C', ['Dimensions/City'], mono, free)
Notes:
  • Note that we have used free key word instead of constrained. This will give the user the flexibility to type the city name directly without need to select form list of values.
  • Note that if the user type Paris while the stored value in @select(Dimensions/City) is PARIS then the query will return no data. To solve this issue you can use the Upper or lower function that will return the given string in upper case format or lower case format.
    UPPER(@select(Dimensions/City)) = UPPER(@prompt (
    'Type a City name:', 'C', ['Dimensions/City'], mono, free))
  • If you want the user to type multiple cities use this form
    @select(Dimensions/City) IN @prompt (
    'Type Cities name:', 'C', ['Dimensions/City'], Multi,
    free)
    Please note that user will enter values comma separated without space Like: (Paris,London,Roma,Cairo)


Example # 4 (From To prompt):
We need to create a new condition that will prompt user to enter "From Date" and "To Date" to display data related to this period in our report.
Create a new condition with the specification below [Insert --> Condition]
  • Name: From To prompt
  • Description: Prompt user to enter a specified period
  • Where:

    @select(Dimensions/As of Date) Between @prompt (
    'From Date:', 'D', ['Dimensions/As of Date'], mono, constrained) AND @prompt ('To Date:', 'D', ['Dimensions/As of Date'], mono, constrained)


Example # 5 (Use prompt with dimensions):
We need to create a new dimension that will display customer segment description based on what language user will select.
Prerequisites:
  • Language dimension Created.
  • Segment English Description created.
  • Segment France Description created.
  • Segment Dutch Description created.
  • Segment Arabic Description created.
Create a new Dimension with the specification below [Insert --> Dimension]
  • Name: Customer Segment Description
  • Description: Customer Segment Description based on the user selected language.
  • Select:
    Decode(@prompt (
    'Select Language:', 'C', ['Dimensions/Language'], mono, constrained),
    'EN', @select(Dimensions/Segment English Description),
    'FR', @select(Dimensions/Segment France Description),
    'DE', @select(Dimensions/Segment Dutch Description),
    'AR', @select(Dimensions/Segment Arabic Description), @select(Dimensions/Segment English Description))
Other information about Prompt:
Similar functions & Useful Links:


If you liked this post, then support me and buy my book:

Saturday, June 6, 2009

Linking Dimensions across different data providers.


Some times you need to define more than one data provider in your report. A common example if you trying to build master detail report having actual data divided between 2 data base table. In this case you have to create 2 separate data providers. While you creating the second one, a pop up wizard will prompting you to link the common dimension between 2 data source. If there are common dimensions between the 2 data sources and with same of type, name and same list of values them the linking will done automatically without the need to prompt the user for action.
If you creating a report that reads data from one database data source and the other reads from an excel file, and there is a common dimension that you need to link with. Just open
Data --> View Data --> definition tab then select your dimension from the left pan.
You will notice the link button at the bottom of the page.
When you click on the link button a window with 2 pans will displayed. You can select the dimension that you want to link with from the right pan while you can select the dimension that you want to link to from the left pan. Click the link button in the middle area.
If you want to unlink 2 dimensions then Go to Data --> View Data --> Definition tab then select your dimension from the left pan and click unlink button.
Example # 1:
Universe # 1 (Current Account Universe)
ClassObject NameDimension / MeasureType
Customer SegmentSegment CodeDimensionNumber
Segment DescriptionDimensionChar
Customer Sub SegmentSub Segment CodeDimensionNumber
Sub Segment DescriptionDimensionChar
ProgramProgram CodeDimensionNumber
Program DescriptionDimensionChar
Regional InformationRegionDimensionChar
AreaDimensionChar
BranchDimensionChar
TimeAs of DateDimensionDate
WeekDimensionnumber
MonthDimensionchar
QuarterDimensionchar
YearDimensionnumber
MeasuresBalanceMeasurenumber
profitMeasureNumber
Universe # 1 (Current Account Universe)
ClassObject NameDimension / MeasureType
Customer SegmentSegment CodeDimensionNumber
Segment DescriptionDimensionChar
Customer Sub SegmentSub Segment CodeDimensionNumber
Sub Segment DescriptionDimensionChar
ProgramProgram CodeDimensionNumber
Program DescriptionDimensionChar
Regional InformationRegionDimensionChar
AreaDimensionChar
BranchDimensionChar
TimeAs of DateDimensionDate
WeekDimensionnumber
MonthDimensionchar
QuarterDimensionchar
YearDimensionnumber
MeasuresCredit card balanceMeasurenumber
Credit card profitMeasureNumber


Report # 1
Current Account
Credit Card
Segment
BalanceProfitBalanceProfit
High Affluent
Mass
Lower Mass


In this example we want to retrieve current account data from current account universe and to retrieve credit card data from credit card universe. Some one may ask why we don't keep both tables in the same universe and make just one query to retrieve date. This may happen because we want to make separate universes for separate products.
Create first data provider:
  • Universe: Current account

  • Dimensions: Year
  • Measures: Balance and profits.
  • Filter: year = 2009
Create second data provider:
  • Universe: Credit Cards
  • Dimensions: Year
  • Measures: Credit Cards Balance and Credit Cards profits.
  • Filter: Year = 2009
In this report the linking will done automatically because the year dimension have the same name, type and list of values across the 2 universes.
What if the segment dimension having different name in credit card universe? Customer group for example. In this case when you create the second data provider the linking window will displayed to prompt the user to select the linking dimension.
Example # 2:
Now if you have an excel file with loans data and you want to include loans information in your report.
Excel file Data
SegmentBalanceprofit
High Affluent
Mass
Lower Mass


You will need to do as follow:
  • Open your report.
  • Create a new data provider based on another data source.
  • Select excel file.
  • Complete the wizard.
  • Go to Data --> View Data --> Definition tab then select your dimension from the left pan and click link button.
  • Link segment dimension form loans data provider with segment dimension from current account data provider.

Wednesday, June 3, 2009

Manage Security with business objects designer.

If you are a universe designer, you will need to specify access levels for groups and users for your universe.

To manage user and group access to your universe do as follow:

  • Tools à Manage Security à Manage Access restrictions
  • The window divided into 2 pans
    • The left pan displays available restrictions
    • The right ban display users and group.

Restrictions:

  • Object level: you can restrict user or group from access a specific object.
  • Row level: you can restrict user or group from access specific rows from specific table based on criteria.
  • Table mapping: display data from another table for user or group.
  • General restriction: connection, control, SQL

Example:

We want to create the following restrictions:

  • Restrict user / group from accessing profit object. (object level)
  • Restrict user / group to display VIP customer's data based on VIP flag column. (row level)
  • Display data for retail users / groups from retail data table instead of displaying it from the corporate table. (table mapping)
  • Limit number of rows retrieved by user query (general)


To preview user and group access to your universe do as follow:

  • Tools à Manage Security àpreview net access restrictions.
  • Select user or group that you want to preview access for.
  • Click preview.

Notes:

  • You can create mixed restriction that mix many types of restrictions (object, row, table mapping and general)
  • If you apply the same restriction to more that one group then you can specify priority for them.

What is Scope of Analysis?

Scope of Analysis is one of the most powerful features in business objects. Now you can easily build your custom hierarchies and use them in your report to navigate through data. To make it easy I will consider a small example then go step by step starting from building the universe and end with how to use the drill feature to navigate through data.

Example:

We have one fact table that contains daily sales and number of customers against branches.

Fact Table:

As of Date

Branch CD

Number of Customer

Total Sale

30-Nov-2008

101

10

4245

30-Nov-2008

102

30

543

30-Nov-2008

103

20

6434

30-Nov-2008

104

40

6543

30-Nov-2008

105

28

3264

30-Nov-2008

106

36

657

30-Nov-2008

107

48

677

30-Nov-2008

108

48

675

31-Dec-2008

101

45

546

31-Dec-2008

102

54

765

31-Dec-2008

103

63

658

31-Dec-2008

104

23

768

31-Dec-2008

105

98

876

31-Dec-2008

106

67

786

31-Dec-2008

107

34

453

31-Dec-2008

108

21

564

31-Jan-2009

101

23

546

31-Jan-2009

102

43

545

31-Jan-2009

103

67

654

31-Jan-2009

104

32

654

31-Jan-2009

105

45

675

31-Jan-2009

106

21

765

31-Jan-2009

107

45

675

31-Jan-2009

108

67

546

28-Feb-2009

101

64

657

28-Feb-2009

102

21

865

28-Feb-2009

103

36

324

28-Feb-2009

104

73

143

28-Feb-2009

105

15

432

28-Feb-2009

106

24

324

28-Feb-2009

107

53

324

28-Feb-2009

108

21

532

31-Mar-2009

101

64

321

31-Mar-2009

102

54

432

31-Mar-2009

103

23

543

31-Mar-2009

104

25

543

31-Mar-2009

105

53

546

31-Mar-2009

106

21

564

31-Mar-2009

107

68

544

31-Mar-2009

108

54

654

30-Apr-2009

101

34

546

30-Apr-2009

102

43

654

30-Apr-2009

103

21

567

30-Apr-2009

104

54

764

30-Apr-2009

105

21

675

30-Apr-2009

106

65

765

30-Apr-2009

107

32

765

30-Apr-2009

108

11

745

31-May-2009

101

33

546

31-May-2009

102

45

547

31-May-2009

103

56

564

31-May-2009

104

78

544

31-May-2009

105

98

654

31-May-2009

106

76

546

31-May-2009

107

65

654

31-May-2009

108

54

567


Branch hierarchy Table:

Region

Area

Branch CD

Branch

Central

First Area Riyadh

101

Branch 101

Central

First Area Riyadh

102

Branch 102

Central

Second Area Riyadh

103

Branch 103

Central

Second Area Riyadh

104

Branch 104

West

Jeddah

105

Branch 105

West

Jeddah

106

Branch 106

West

Mekkah

107

Branch 107

West

Mekkah

108

Branch 108


Time hierarchy Table:

As of Date

Month

Quarter

Year

30-Nov-2008

Nov

Q4

2008

31-Dec-2008

Dec

Q4

2008

31-Jan-2009

Jan

Q1

2009

28-Feb-2009

Feb

Q1

2009

31-Mar-2009

Mar

Q1

2009

30-Apr-2009

Apr

Q2

2009

31-May-2009

May

Q2

2009


Build The Universe:

To build the universe just adds the Fact Table and the 2 hierarchy tables. Make the proper joins and create 3 main classes:


Tables:

  • Fact Table.
  • Branch Hierarchy table.
  • Time hierarchy table.

Classes (Universe window should be like this):

Fact Table (class)

----------------------

| -----> As of Date (Dimension)

| -----> Branch Code (Dimension)

| -----> Number of Customers (Measure) [Sum]

| -----> Total Sales (Measure) [Sum]


Time Hierarchy (Class)

----------------------

| -----> As of Date (Dimension)

| -----> Month (Dimension)

| -----> Quarter (Dimension)

| -----> Year (Dimension)


Branch Hierarchy:

-----------------------

| ----->Region (dimension)

| ----->Area (dimension)

| ----->Branch CD (dimension)

| ----->Branch (dimension)

Joins:

First Table

Second Table

Join criteria

Fact Table

Branch Hierarchy table

Branch CD = Branch CD

Fact Table

Time hierarchy table

As of Date = As of Date


Hierarchies:

By default in business objects it consider every dimension created as a standalone hierarchy. By for some cases as our example you want to define a custom hierarchy like time, geographical information and customer segmentation…etc. in our example we need to build 2 custom hierarchies.

Click on hierarchies button from the editing tool bar or go Tools --> Hierarchies

Select the custom hierarchy option and then start building your hierarchy.

You can just add the Time Hierarchy class and Branch Hierarchy class from the left ban to the right ban. Or you can click new button from the right ban. Then type you hierarchy name. after that start adding dimensions from the left ban to your hierarchy tree. When you finish you can start order your hierarchy level by clicking move up and down buttons. Your hierarchy tree should be like this at the end:

Branch Hierarchy:

-----------------------

| --------- > Region

| --------- >Area

| --------- >Branch

Time Hierarchy:

----------------------

| --------- > As of Date

| --------- > Month

| --------- >Quarter

| --------- >Year

Note That if you even store all your data as detailed in one big table you will be able to build your hierarchy based on dimension that you will select to construct your customer hierarchies. For example assume if the fact table looks like this.

As of date

Month

Quarter

Year

Branch

Area

Region

No of Cust

Total Sales


This table is no more fact table and we call it a detail table.


Scope of analysis:

Now after we finish bulding our univers let go and build our report. Assume that we just need to build a very simple report like this

Year

2008

2009

Region

No of Cust

Total Sales

No of Cust

Total Sales

center

342

23432

234

23432

west

234

23424

424

324


Create a new report based on our universe that we build earlier. Select region, year, number of customer and total sales then run the report. After that click on the drill icon (Analysis --> Drill) and then right click on any of the selected dimension (region, year) you will find that there is no option to drill by.

Now edit data provider (Data --> Edit data provider) and click view SQL button for the tool bar. You will find that the data selected are just the four columns that we have selected. Now to find what Scope of Analysis do click on the Scope of Analysis button and select both time and branch hierarchies. Please note that you can expand the hierarchies build before and select a specific dimensions. Let's assume that you want to analysis your figures by quarter, and year only and you are not interested in monthly figures or daily figures. Then all what you need is to put a check mark in the check box beside year and quarter in the time hierarchy tree when you open the scope of analysis window.

Now click again on view SQL button and note that all dimension with a check make beside in scope of analysis added to your SQL statement even if you didn't select them in the query builder window (remember that we have selected 2 dimensions [region and year])

Run the report after that.


Drill:

After running the report click on drill icon (analysis à drill) and then right click on region you will find that you can do the following:

  • Drill down: will go to the second level of the hierarchy. In our example it will display the area information and note that there is a drill down filter (combo box) displayed in the drill down filter tool bar. If you right click again on are and select drill down you will go to the second level (branch) and so on. If you filter on a specific region from the drill down menu it will just display the selected region date.
  • Drill up: will go a level up. If you were in area and click on drill up it will return back to region.
  • Drill by: a menu will displayed contains all hierarchy that you have selected in scope of analysis. The menu should be like this if you right click on region dimension
  • Drill by:
    Area
    Branch
    ----------
    Quarter


  • Drill through: to select another dimension that you didn't select in scope of analysis. In our example it will be month because we select year and quarter only from the time hierarchy tree.


  • Scope of analysis: if you want to update hierarchies that you want to analysis your data according to.
  • Set as drill filter: make this column a drill filter that you can filter your report data from it.