Search

Custom Search
Showing posts with label Webi. Show all posts

Wednesday, October 30, 2013

Prompt in SAP Business Objects WEBI Report

Introduction:

There is 2 types of filters that you can use in create query in your Webi report.

Static Filters: Doesn't need any interaction from the end user. the criteria or filter values are impeded inside the filter and will submitted directly to the database. Static filter is either created in the universe and you can just drag and use them. They will appears like a yellow cone. You can also create your own static filters by dragging an object and set you filter values to constant or select from list of values. Again, when you refresh data fro your report it will not ask the end user to enter any values as the filter values already defined.

10-22-2013 1-19-06 PM

10-22-2013 1-21-50 PM

Dynamic Filters: [Also known as prompt] It will prompt or ask the end user to enter or select filter values before submitting the query to the database. You can create your prompt in the universe designer and make it available and ready for use or you can do it on the report development time. For more information about how to create prompt in universe click here.

To create a prompt in info view or rich client data query just drag the object that you want to use it as a prompt let say Region or Product for example. Then select the required operator, let’s say Equal to or greater than. After that you need to select Prompt in the filter value.

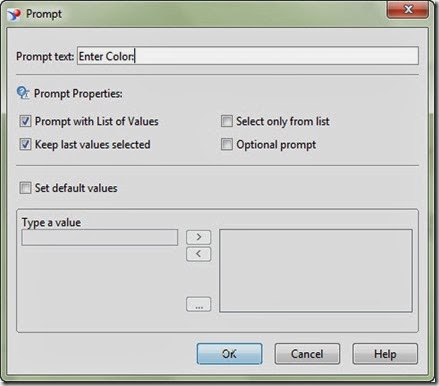
The following window will displayed to set the prompt the following prompt options:

 Prompt Text: Enter the text that will be displayed for the end user to ask him to enter or select value.

Prompt Properties:

Prompt with list of values: Will display a list of values for the selected object to the end user. the end user will be able to select one or multiple value instead of entering them manually.

Keep Last Value selected: Will keep the last value entered by the end user selected.

Select only from list: end user will not be able to enter any data manually and he will just forced to select from the list of values. of course this option will be enabled only of we selected the prompt with list of values option.

Optional prompt: If this option is selected the end use will be able to skip this prompt. the value will be considered only if the end user selected a value for this prompt.

Set Default Values: You can enter Default values here.

10-22-2013 1-24-06 PM

Best Practice:

“As you can create static and dynamic filter in the universe you need to differentiate between them. we used to write [Filter] beside the static filter name like: Last Year [Filter]. and we use the “?” at the end of filter name if it is a dynamic one [Prompt] like: Enter Year ?”

“Choose a clear prompt message”

“If you will use the prompt with list of values option then you have to optimize it from the universe to insure the performance”

Sunday, September 29, 2013

BO InfoView & Rich client Fast User Manual (Tutorial) (Part # 2–View Mode)

Overview:

This is part 2 of SAP Business Objects user guide. Today we will explain Webi view mode in details. We will go through different menus, Functionality and features. This tutorial apply for both InfoView as well as rich client. Please note also that this user manually build using BOXI3 version but it is almost same in BO4.

I suggest to read Part # 1 first:

Part # 1: BO InfoView & Rich client Fast User Guide (Tutorial) (Part # 1 - Navigation)

View

When you select Webi report and double click on it or right click and select view, the report will be displayed in view mode. Find below the main functionality that you can use during view mode:


clip_image002

Document:

  • Close: Close current document
  • Edit: Open edit mode for current document. [If you have write rights]
  • Save: Save current document
  • Save As: Save current document in different name and location
  • Save to my computer as: save document as excel, CSV or PDF
  • Save Report to my computer as: Save current report only. [Note: Document can have multiple tabs (Reports)]

clip_image008

View:

  • Quick Display Mode: Display data only without page borders or layout.
  • Page Mode: Display report in page mode. You should use this mode to optimize layout before printing.
  • Draft Mode:
  • PDF Mode: Show as PDF
  • Left Panel: Show/ hide left panel.
  • Status Bar: Show / Hide status bar.
  • Fold /Unfold: Expand / Collapse section.


Other Options:

  • Save Report
  • Print Report
  • Find Text in Report: Like find feature provided by Microsoft in MS Office & MS Windows.
  • Zoom:

clip_image012

  • Page Navigation: go to next page, previous page, first page and last page. You can also enter specific page number to jump immediately to that page.clip_image018
  • Edit:
  • Refresh Data: It will open the prompt wizard if there is a prompt in that report. Otherwise it will refresh data and return back results.clip_image004clip_image006
  • Track: I will create a separate post for this topic.
  • Simple Filter: show / Hide simple filter bar. You can select report dimension from here and a drop down menu will display all possible values for that dimension. You can then select a specific value to filter the report on that selected value.
  • Drill Mode: Activate drill mode. This is very useful to analysis data displayed in the report. You need to have a pre-selected hierarchies like time for example: [Year- Quarter – Month – Date]. Hierarchy are built in universe and can be selected and configured in query editor and scope of analysis area.
  • Take Snapshot: Used with drill mode to take a snapshot from the current drill paths selected.

BO InfoView & Rich client Fast User Manual (Tutorial) (Part # 1 - Navigation)


Overview:

This is a fast walkthrough, User Manual and tutorial on BusinessObjects (BO) Web Inelegance (WEBI). This can be useful for InfoView And Rich client BOXI3 as well as BI Launch pad BO4. This user guide should help you to understand the basic functionality and features provided by BO web intelligence. Don’t hesitate to leave me a comment if you find anything useful to add.


Login:

Main screen please note that if you are using InfoView it will not ask you about system. As every system have his own URL while if you are using Rich Client, It will ask you to enter your system name. First I will explain how to access your system:

Info View: Link should be like this: https://<Server Name>:<Port Name>/InfoViewApp/logon.jsp Example: https://boProd:9009/InfoViewApp/logon.jsp

Rich Client: Go to the following Path: Start Menu --> All Programs --> BusinessObjects XI 3.1 --> BusinessObjects Enterprise Client Tools --> Web Intelligence Rich Client

  Web Intelligence Rich Client

The required login Information described below:

  • System: this your system name. If you have multiple environment like Development, SIT, UAT and production then you may have a different system name for each. System name is identified by <BO instance name>: <Port number>. Example: [boProd1:6401] without brackets.
  • User Name: your user name and it it will depend on your authentication method. So for example if you selected LDAP so you need to provide LDAP user and password. If you for example selected Enterprise, then you should provide a valid user name & password that defined on BO server by BO administrator.
  • Password: your password.
  • Authentication:
    • Enterprise: credential are kept on BO server and can be created, edited and removed from CMC screen by the BO administrator.
    • LDAP:
    • Windows AD
    • Windows NT
    • Stand alone
  • Use offline mode

Please note that System & use offline mode are only displayed when you are trying to login from Rich Client only. As we mention before, System information are included in URL when we are trying to login into InfoView and there is no offline mod in InfoView.


clip_image004

Navigation:

After you login successfully to the system you will see the following screen. Let’s go through all available options:

Navigation

· 

Main Tool Bar:
  • Home: Will return you back to this page.
  • Document List: Navigate through your reports. You can navigate them by category or by folder.
  • Help: Display help menu.
  • Preferences: Configure and personalize your settings.
  • About: information about BO release and license.
  • Logout

clip_image008

Navigate:
  • Document List: Navigate through your reports. You can navigate them by category or by folder.
  • My Favorites: This is your own area and you are the only one who can access this folder (beside BO administrator of course). You have a full privilege on that folder and you can build your own analysis here.
  • My Inbox: All reports scheduled to be send to your Inbox folder.
Personalize:
  • Preferences: Configure and personalize your settings.

As you can see you can access the same option from many places.


Report options

After you click on document list, the following screen will be displayed. You can navigate through your reports by folders or by categories

Toolbar menu:
  • Folder: Navigate your reports by folders
  • Category: Navigate your reports by category
  • Refresh: Refresh report list
New:
  • Hyperlink: You can use this option to create a hyperlink for any relative site.
  • InfoView page layout: Portal Page
  • Publication: We will have a detailed post on publications
  • Web Intelligence document: This option used to create a new Webi Document.
  • Analytic
  • Category: create a new category
  • Folder: Create a new folder
New Menu
Add
  • Crystal Report
  • Local Documents: You can add local Microsoft [Word, Excel and PowerPoint] or PDF document to the current selected folder.
Add Menu
Organize
  • Cut: Cut the selected object/ Document.
  • Copy: Copy the selected object/ Document.
  • Copy Shortcut: Copy the relative path for the current object or document.
  • Past: works as Microsoft Windows.
  • Delete: Remove the selected object / Document.
Organize Menu
Actions:

It will display a customized menu based on the selected object from the navigation area.

Action Menu

If you right click on any report, the following popup menu will be displayed:

View: Open Webi report in view mode

Properties: Open properties window for the selected document.

Categories:

Modify: Open selected Webi report in edit mode

Schedule: Create a scheduler for that report. (We will have a separate post for this topic)

History: Display the history for all instances generated from report schedule.

New: As described before.

Add: As described before

Organize: As described before.

What is the difference between folder and category?

Folders: Folders are physical containers that used to store mutable related objects/ Documents.

Category: Virtual & logical grouping for reports or documents. The reports are physicaly stored in folders and can exists in only one folder while you can to refere to the same report from more that one category. Normally categories is better to represent business calsification while folder is better for data classification.

Example:

We have 2 data areas:

  • Customer Information
    • Customer Search Report
    • Customer relatives
    • Customer Segmentation
  • Current Account
    • Account Statement
    • Last 10 Transaction by Account
    • Top 10 transactions Today

We have 3 business groups:

  • Tellers:
    • Customer Search Report
    • Account Statement
  • Marketing:
    • Customer Search Report
    • Customer Relatives
    • Customer Segmentation
    • Account Statement
    • Last 10 Transaction by account
  • Fraud, Compliance & Risk Department
    • Customer Search Report
    • Account Statement
    • Top 10 transaction Today.

As you can see from data point of view the report can created only once under it is corresponding data area. While the same report can serve many business departments. Let’s imagine that we don’t have category feature, in this case we should build our security model to allow every department to access their reports only. This will lead to duplicating same report in many folders just to fulfill this security constrain. But because we have categories feature we can create report once and map it to many categories. I will create a special post to cover this topic in details.

Friday, September 27, 2013

Rank

Description:

You can use rank to generate a report that display for example top 10 customers based on sales information or bottom 10 branches based on their profit. To do that in BO we have 2 Methods.


[Method # 1]: Apply Rank from the Webi report

In this method you can click on Apply/ Remove rank button () to add rank on the selected column.

This will open the following Wizard to set Rank properties:

Ranking Properties:

In ranking properties you can select your ranking direction. if you want to display top records in your ranked list then just tick check box beside Top. If you want to display records at bottom of your list then select Bottom. You can also enter the number of records that you want to display. for example if you select Top and entered 10 in the text box beside it then it will display top 10 records if you selected count as a calculation mode.


Based on:

select the measure that will be used to rank your records. You may have more than one measure displayed in your table but you can only rank them based on one of them.


Ranked By:

Select the dimension associated with this rank. 


Calculation Mode:

  • count: will stop ranking after it reach for that count. For example if you selected Top 10 with count as calculation mode it will keep displaying records on top of your list till the 10th record.
  • Percentage: 
  • Cumulative sum: it will keep displaying records till reach the limit specified in ranking properties.
  • Cumulative Percentage:

Example:

Find below the raw data that we will use in our example:

Branch Transaction Amount Transaction Volume
101 50,000 100
102 1,000,000 600
103 60,000 250
104 950,000 700
105 150,000 460
106 2,000,000 800
107 200,000 300
108 500,000 620
109 350,000 430
110 1,900,000 850
Now lets check the following ranking cases:

Case # 1:

Description: Display top 5 branches based on their transaction volume

Ranking Properties:

Top  [ 5 ]

Based on [ Transaction Volume]  Ranked by [   ]

Calculation Mode: Count

Results:

Branch Transaction Amount Transaction Volume
110 1,900,000 850
106 2,000,000 800
104 950,000 700
108 500,000 620
102 1,000,000 600


Case # 2:

Description: We need to display branches that performed 80% of total transaction volume

Ranking Properties:

Top  [ 80%]

Based on [ Transaction Volume]  Ranked by [   ]

Calculation Mode: Cumulative Percentage

How it Works:

Branch Amount Volume % Cum %
110 1,900,000 850 17% 17%
106 2,000,000 800 16% 32%
104 950,000 700 14% 46%
108 500,000 620 12% 58%
102 1,000,000 600 12% 70%
105 150,000 460 9% 79% **
109 350,000 430 8% 87%
107 200,000 300 6% 93%
103 60,000 250 5% 98%
101 50,000 100 2% 100%

** Limit Achieved

Results:

Branch Amount Volume
110 1,900,000 850
106 2,000,000 800
104 950,000 700
108 500,000 620
102 1,000,000 600
105 150,000 460


Notes:
  • We ranked our data based on Volume and we didn’t consider Transaction amount in our calculation.
[Method # 2]: Apply Rank from the Edit Query window

In this method you will retrieve only the ranked data from the database.

Useful Links:


Friday, August 30, 2013

Sort

Usually we need to sort data when we want to present it. You have 3 sorts direction as follow:

  • Ascending: from smaller to greater
  • Descending: reverse order
  • Customized: based on your customized order

And we can sort on the following level:

  • Column: sort data in table based on the selected column [tabular & cross table]
  • Row: Sort data in table based on the selected row [Cross table]
  • Table: if you have more than one sorted data set we can order or priorities them from this menu.

We can sort data by activating the required column or row then:

  • Click on the sort icon.
  • go to insert menu, then go to sort and select the sort direction.
  • from the properties tab on the left, go to sort part and select the required sort direction

Method # 1:

Sort Button

Method # 2:

Indert Sort

Method # 3:

Properties Sort

Finally please note the following:

Note # 1: In custom sort you can change the order of the displayed values manually by promoting and demoting values. This option is reasonable to be used with small list of values.

Note # 2: In custom sort you can add values not in the list for example if you have a custom sort on currency like shown in the figure below. In this example we know that we have 3 currencies (USD, JPY & SAR) but only 2 of them displayed. If we want to consider the 3rd currency as well when it show up in our data you can simply type in in the temporary values and assign it the right position.

Custome Sort

Note # 3: You can set the sort order priority on a table if you have more than one level of sorts from the properties tab after activating that table.


Table Sort Priority

Saturday, June 6, 2009

Linking Dimensions across different data providers.


Some times you need to define more than one data provider in your report. A common example if you trying to build master detail report having actual data divided between 2 data base table. In this case you have to create 2 separate data providers. While you creating the second one, a pop up wizard will prompting you to link the common dimension between 2 data source. If there are common dimensions between the 2 data sources and with same of type, name and same list of values them the linking will done automatically without the need to prompt the user for action.
If you creating a report that reads data from one database data source and the other reads from an excel file, and there is a common dimension that you need to link with. Just open
Data --> View Data --> definition tab then select your dimension from the left pan.
You will notice the link button at the bottom of the page.
When you click on the link button a window with 2 pans will displayed. You can select the dimension that you want to link with from the right pan while you can select the dimension that you want to link to from the left pan. Click the link button in the middle area.
If you want to unlink 2 dimensions then Go to Data --> View Data --> Definition tab then select your dimension from the left pan and click unlink button.
Example # 1:
Universe # 1 (Current Account Universe)
ClassObject NameDimension / MeasureType
Customer SegmentSegment CodeDimensionNumber
Segment DescriptionDimensionChar
Customer Sub SegmentSub Segment CodeDimensionNumber
Sub Segment DescriptionDimensionChar
ProgramProgram CodeDimensionNumber
Program DescriptionDimensionChar
Regional InformationRegionDimensionChar
AreaDimensionChar
BranchDimensionChar
TimeAs of DateDimensionDate
WeekDimensionnumber
MonthDimensionchar
QuarterDimensionchar
YearDimensionnumber
MeasuresBalanceMeasurenumber
profitMeasureNumber
Universe # 1 (Current Account Universe)
ClassObject NameDimension / MeasureType
Customer SegmentSegment CodeDimensionNumber
Segment DescriptionDimensionChar
Customer Sub SegmentSub Segment CodeDimensionNumber
Sub Segment DescriptionDimensionChar
ProgramProgram CodeDimensionNumber
Program DescriptionDimensionChar
Regional InformationRegionDimensionChar
AreaDimensionChar
BranchDimensionChar
TimeAs of DateDimensionDate
WeekDimensionnumber
MonthDimensionchar
QuarterDimensionchar
YearDimensionnumber
MeasuresCredit card balanceMeasurenumber
Credit card profitMeasureNumber


Report # 1
Current Account
Credit Card
Segment
BalanceProfitBalanceProfit
High Affluent
Mass
Lower Mass


In this example we want to retrieve current account data from current account universe and to retrieve credit card data from credit card universe. Some one may ask why we don't keep both tables in the same universe and make just one query to retrieve date. This may happen because we want to make separate universes for separate products.
Create first data provider:
  • Universe: Current account

  • Dimensions: Year
  • Measures: Balance and profits.
  • Filter: year = 2009
Create second data provider:
  • Universe: Credit Cards
  • Dimensions: Year
  • Measures: Credit Cards Balance and Credit Cards profits.
  • Filter: Year = 2009
In this report the linking will done automatically because the year dimension have the same name, type and list of values across the 2 universes.
What if the segment dimension having different name in credit card universe? Customer group for example. In this case when you create the second data provider the linking window will displayed to prompt the user to select the linking dimension.
Example # 2:
Now if you have an excel file with loans data and you want to include loans information in your report.
Excel file Data
SegmentBalanceprofit
High Affluent
Mass
Lower Mass


You will need to do as follow:
  • Open your report.
  • Create a new data provider based on another data source.
  • Select excel file.
  • Complete the wizard.
  • Go to Data --> View Data --> Definition tab then select your dimension from the left pan and click link button.
  • Link segment dimension form loans data provider with segment dimension from current account data provider.