Search

Custom Search

Friday, August 11, 2017

Tableau Tips and Tricks: Create User Filter

The “Create user filter” feature in Tableau desktop can be
used implement row-level security to display filtered information based on
logged in user authorization. This means that same Tableau dashboard will
display only central region information for central region manager while the
same dashboard will display eastern region information for the eastern region
manager.

Tuesday, September 15, 2015

Great Chance, Buy and SAVE

Great Chance,

Use the following code on PACKT site (https://www.packtpub.com/) to get 50% discount on the eBook version of (Learning SAP BusinessObjects Dashboard). Hurry up!!! The offer will end on 21-Sep-2015 - save 22$ (83 SAR) !!!

Tuesday, June 30, 2015

Learning SAP BusinessObjects Dashboards

Create professional, stunning, and interactive visual dashboards for both desktop and mobile devices.
Whether you are a beginner or an advanced user, this book will help you to create stylish and professional looking dashboards in no time. It is also intended for BI developers who want to use SAP BO to facilitate BI in their organizations. No prior knowledge is required, however, you must have a basic knowledge of MS Excel and some analytical skills to build expressive business charts.
Amazon: http://www.amazon.com/Learning-BusinessObjects-Dashboards-Taha-Mahmoud/dp/1785286625/ref=sr_1_4?s=books&ie=UTF8&qid=1435607625&sr=1-4&keywords=taha+m.+mahmoud
PACKT:https://www.packtpub.com/big-data-and-business-intelligence/learning-sap-businessobjects-dashboards

About This Book

  • Connect to your data and create business-driven interactive dashboards using SAP BusienssObjects Dashboards 4.1
  • Make better business decisions, analyze information, and maximize the value of data with the help of these eye-catching dashboards
  • A step-by-step guide that will help you to master dashboard creation using SAP BusinessObjects Dashboards

Who This Book Is For

This book will help beginners to create stylish and professional looking dashboards in no time. It is also intended for BI developers who want to use SAP BO to facilitate BI in their organizations. No prior knowledge is required, however, you must have a basic knowledge of MS Excel and some analytical skills to build expressive business charts.

Table of Contents

What You Will Learn

  • Create interactive dashboards for both desktop and mobile users
  • Add charts, single-value components, and maps to your dashboard
  • Use selectors to control your dashboard
  • Use advanced features such as dynamic visibility, insertion, and alerts
  • Style your dashboard by adding images and control a dashboard component's appearance
  • Export, publish, and import a dashboard
  • Connect your dashboard with real dynamic data using the connection manger
  • Find ways to secure your dashboard

In Detail

SAP BusinessObjects Dashboards is a leading Business Intelligence and reporting tool that provides you with a real-time understanding of your business with agile visualizations.
Starting with an introduction to Dashboards and its benefits, the book slowly moves on to explain the dashboard creation process. After this, you will learn how to add charts, single-value components, maps, selectors, and other third-party plugins to the existing dashboards. Furthermore, it shares many best practices and will also help you to connect your dashboard to real data by establishing a data connection to a data source. You can also explore more about mobile BI and learn how to create dashboards for mobile devices. By the end of the book, you will be able to prepare, plan, and design interactive dashboards based on your business requirements using this cutting-edge BI tool.

Authors

Taha M. Mahmoud

Taha M. Mahmoud (PMP, TOGAF, ITIL, and CSM) is a senior BI consultant, BI project manager, and solution architect. He has a BS degree in computer science and automatic control from Alexandria University, Egypt. He has a great passion for new technologies, especially those related to business intelligence. Taha has more than 9 years of experience in working on, consulting for, and deploying successful BusinessObjects projects in the banking and telecom industries. He is the author of Creating Universes with SAP BusinessObjects. You can contact him on Twitter at @tahama_2000 or visit his blog (http://business-objects-xi.blogspot.com/).

Wednesday, December 4, 2013

Friday, November 8, 2013

Business Objects (BO) Interview Questions [Part # 1]


1) What is alias table means? When we should use it & how to create it?

Alias Table: Is a copy (alias) from a database object. 
When to use it: we normally create an alias if we have one dimension shared among more than one fact table. to avoid loops we create as many aliases from the shared dimension table and use aliases to connect to fact tables.
How to create it? Right click on the required table and select alias from the menu. You need to give a unique name to alias table.

2) What is Derived table? When shall we use it? How to create it?

Derived table: is like database view. you can create it inside universe designer if you don’t have database privilege to create database view.  You need SQL select query to define the view and name to be assigned to derived table.
When to use it: We use derived table in the following cases
  • You have complex query with advanced SQL coding.
  • if you have one master lookup table and you want to create small customized version for each lookup included in this lookup table.
How to create derived table: right click in an empty place in foundation layer [physical layer] in sap BO universe designer and select derived table from the menu. Enter a name for the derived table & SQL query to define the table.
for more detail information check this link [Derived table in SAP BO]

3) What is Scope of Analysis?

Scope of Analysis is one of the most powerful features in business objects. Now you can easily build your custom hierarchies and use them in your report to navigate through data. To make it easy I will consider a small example then go step by step starting from building the universe and end with how to use the drill feature to navigate through data.For more detailed information check this link [What is Scope of Analysis?]


4) What is Micro Cube in SAP Business Objects

When you create data query in SAP business Objects the data retrieved and stored in a Micro cube, known also as Webi micro cube. This Micro Cube is stored along with the report and the report size will vary based on the saved micro cube size. BO reporting engine will use this microcube to display data on the report based on the selected objects and based on the aggregation function associated with each measure. to reduce the micro cube size you need to assign database aggregation function on each measure. This will submit a grouped by query to the data base and it will reduce the micro cube size and it will enhance the overall report performance. For more information check the following link [Micro Cube in SAP BO]


5) What is aggregate aware function? when to use it?

This function used to increase the performance by directing the report query to select objects form the aggregated table instead of the detailed table.
It may be also used to make some objects incompatible with some others. The best example for such case is the stand alone table that you add in your universe for a specific report. For sure you don’t want the user select other incompatible objects from other incompatible tables. for more detailed information check this link [@Aggregate_Aware()]


You can find a complete step by step guide on how to create a Universe from scratch using SAP BO information Design Tool in "Creating Universes with SAP BusinessObjects" book:


Friday, November 1, 2013

Business Objects


What is business objects?

Business objects is one of the leading companies in BI & Reporting. The company was created on 1990 and finally accrued by SAP on 2007. There were many products offered by business objects but the most famous one is Business Objects XI. The first official SAP release was SAP Business Objects XI3. The last available version of SAP business objects is BO R4 and the frame work was completely changed in that version to comply with Microsoft ribbon technology. The integration between Business objects and other SAP products was dramatically enhanced in this version as well.

Business Objects version history:

Release Name No of Service Pack Release Date
BusinessObjects 3.x NA 1995
BusinessObjects 5 11 1999
BusinessObjects Enterprise 6.x 9 2003
BusinessObjects Enterprise XIR2 5 2005
SAP BusinessObjects Enterprise XI3 5 2008
SAP BusinessObjects BI4 ?? 2011


List of Business Objects Tools:

  • Universe Designer
  • Rich Client.
  • Desktop Intelligence.
  • Translation Manager.
  • Import manager

Wednesday, October 30, 2013

Prompt in SAP Business Objects WEBI Report

Introduction:

There is 2 types of filters that you can use in create query in your Webi report.

Static Filters: Doesn't need any interaction from the end user. the criteria or filter values are impeded inside the filter and will submitted directly to the database. Static filter is either created in the universe and you can just drag and use them. They will appears like a yellow cone. You can also create your own static filters by dragging an object and set you filter values to constant or select from list of values. Again, when you refresh data fro your report it will not ask the end user to enter any values as the filter values already defined.

10-22-2013 1-19-06 PM

10-22-2013 1-21-50 PM

Dynamic Filters: [Also known as prompt] It will prompt or ask the end user to enter or select filter values before submitting the query to the database. You can create your prompt in the universe designer and make it available and ready for use or you can do it on the report development time. For more information about how to create prompt in universe click here.

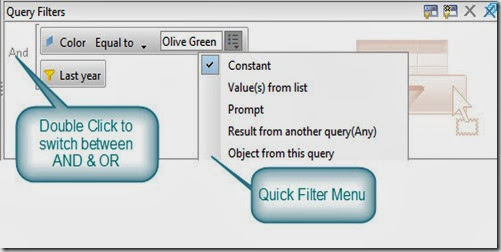
To create a prompt in info view or rich client data query just drag the object that you want to use it as a prompt let say Region or Product for example. Then select the required operator, let’s say Equal to or greater than. After that you need to select Prompt in the filter value.

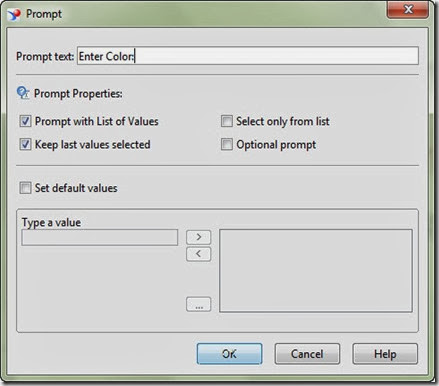
The following window will displayed to set the prompt the following prompt options:

 Prompt Text: Enter the text that will be displayed for the end user to ask him to enter or select value.

Prompt Properties:

Prompt with list of values: Will display a list of values for the selected object to the end user. the end user will be able to select one or multiple value instead of entering them manually.

Keep Last Value selected: Will keep the last value entered by the end user selected.

Select only from list: end user will not be able to enter any data manually and he will just forced to select from the list of values. of course this option will be enabled only of we selected the prompt with list of values option.

Optional prompt: If this option is selected the end use will be able to skip this prompt. the value will be considered only if the end user selected a value for this prompt.

Set Default Values: You can enter Default values here.

10-22-2013 1-24-06 PM

Best Practice:

“As you can create static and dynamic filter in the universe you need to differentiate between them. we used to write [Filter] beside the static filter name like: Last Year [Filter]. and we use the “?” at the end of filter name if it is a dynamic one [Prompt] like: Enter Year ?”

“Choose a clear prompt message”

“If you will use the prompt with list of values option then you have to optimize it from the universe to insure the performance”