Search

Custom Search

Wednesday, October 30, 2013

Prompt in SAP Business Objects WEBI Report

Introduction:

There is 2 types of filters that you can use in create query in your Webi report.

Static Filters: Doesn't need any interaction from the end user. the criteria or filter values are impeded inside the filter and will submitted directly to the database. Static filter is either created in the universe and you can just drag and use them. They will appears like a yellow cone. You can also create your own static filters by dragging an object and set you filter values to constant or select from list of values. Again, when you refresh data fro your report it will not ask the end user to enter any values as the filter values already defined.

10-22-2013 1-19-06 PM

10-22-2013 1-21-50 PM

Dynamic Filters: [Also known as prompt] It will prompt or ask the end user to enter or select filter values before submitting the query to the database. You can create your prompt in the universe designer and make it available and ready for use or you can do it on the report development time. For more information about how to create prompt in universe click here.

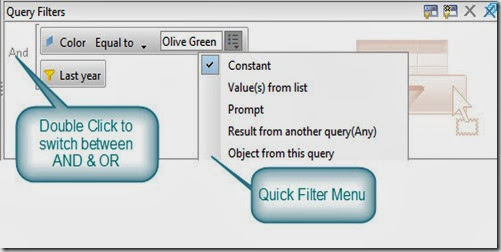
To create a prompt in info view or rich client data query just drag the object that you want to use it as a prompt let say Region or Product for example. Then select the required operator, let’s say Equal to or greater than. After that you need to select Prompt in the filter value.

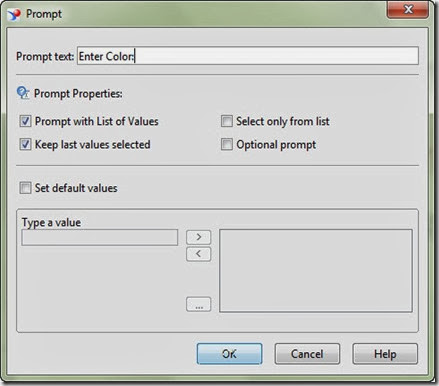
The following window will displayed to set the prompt the following prompt options:

 Prompt Text: Enter the text that will be displayed for the end user to ask him to enter or select value.

Prompt Properties:

Prompt with list of values: Will display a list of values for the selected object to the end user. the end user will be able to select one or multiple value instead of entering them manually.

Keep Last Value selected: Will keep the last value entered by the end user selected.

Select only from list: end user will not be able to enter any data manually and he will just forced to select from the list of values. of course this option will be enabled only of we selected the prompt with list of values option.

Optional prompt: If this option is selected the end use will be able to skip this prompt. the value will be considered only if the end user selected a value for this prompt.

Set Default Values: You can enter Default values here.

10-22-2013 1-24-06 PM

Best Practice:

“As you can create static and dynamic filter in the universe you need to differentiate between them. we used to write [Filter] beside the static filter name like: Last Year [Filter]. and we use the “?” at the end of filter name if it is a dynamic one [Prompt] like: Enter Year ?”

“Choose a clear prompt message”

“If you will use the prompt with list of values option then you have to optimize it from the universe to insure the performance”

CORBA Initialization failed. (WIS 10901) error in WebI Rich Client


Today we faced a power frailer in our building. I was using Rich client and logged in by user name & password. After My PC was restarted I able to do the following:

  • Login to rich client.
  • Navigate to a Webi report and open it in rich client.

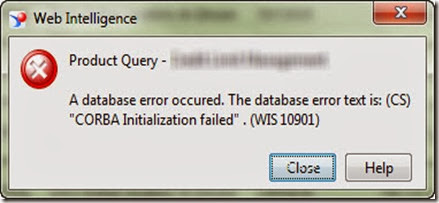
When I tried to refresh any report from Rich client I got the following error Message:

Query Name – Universe Name

A database error occurred. The database error text is: (CS) “COBRA Initialization failed”. (WIS 10901)

10-29-2013 10-52-46 AM

Error Message:

Code: WIS 10901

Error Message: A database error occurred. The database error text is: (CS) “COBRA Initialization failed”.

Application: Rich Client

Environment: BO XI3.1


Notes:

  • You will be able to refresh the data in the same report If you tried to login to info view and refresh it from there.


Resolution:

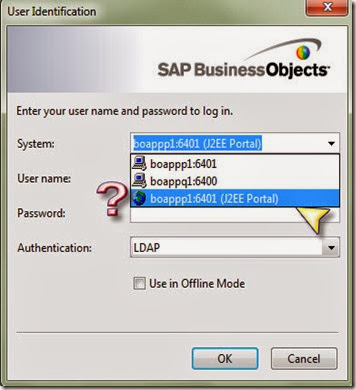
Resolution Method # 1: Don’t log to the JR2 system. Log into the original one. The error message will be displayed if you tried to login to the system beside the (?)

10-29-2013 10-55-34 AM

Resolution Method # 2: Restart the connection server from CMS

Saturday, October 26, 2013

Create data query in business objects WEBI


In order to ask for data retrieval from Database or any support data source by business objects you need to create a query in your report. In this query you have to identify what you want to include in your report and you will define query filters as well to narrow the returned data results. If you are familiar with SQL then you will not find any troubles to understand this section. If no then you will learn SQL select statement as well as how to create query in SAP business objects WEBI.

SQL select statement:


the simple SQL statement should contains at least the following SQL clause Select-From-Where. After select clause you should enter the data that you want to display and retrieve from database. In the from clause you have to specify from which tables. And in the where clause you need to set you filters. Lets take an example

Select Statement Syntax:

Select {List of columns that you want to display}

From {List of tables}

Where {Criteria to narrow the number of returning records}

Example:

Select employee_Name, employee id
From employee
Where employee grade =A

Create Data Query in BO WEBI Report:

Now check the data query window below. you can easily find that it almost the same concept & logic. Your available data listed in the left panel. As you can see it is grouped in folder as per their business meaning and relation. you can also differentiate between dimensions, Measures & detail objects. On the right hand side you can see the select area as well as the where or filter panel. To create a query simply drag and drop data from the left side panel to the select area. if you want to create a filter, then you need to drop your object in the where are instead,

Finally to run the query just click on the refresh data button.

Create query tutorial

Find below a step by step user guide and tutorial with examples on how to create a data query in SAP business objects Webi report. Please note that this apply to rich client as well as info view.

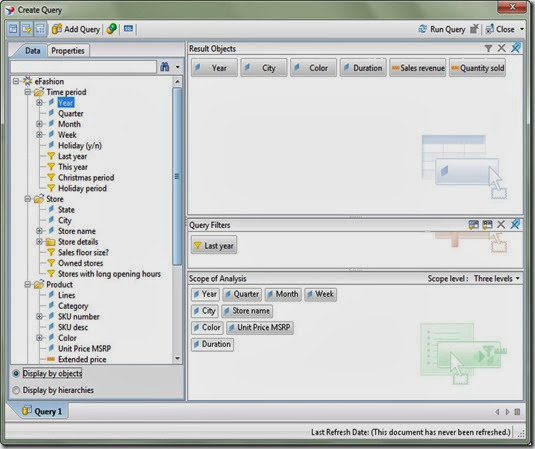
To create a new query in your report go to data or click edit query button. The following window will open

Create Query # 1

We can classify work area here into 4 main panels

Upper tool bar:

Show hide filter ban: This icon will hide or show the filter ban. Filter ban is the area that represent the Where clause in SQL select statement and it will contains your criteria that will be used to narrow the number of returned records or to only retrieve the data corresponding to your analysis.
Show hide scope of analysis: This will show/ Hide your scope of analysis area. for more information about scope of analysis please click on the following link.
Show / Hide data manager: This icon will show or hide data ban which contains all available data based on the selected universe. We will talk about this topic in details in a moment.
Add Query: This button will create another query. You can create as many queries as you can in your report. you can use the bar at the bottom to navigate through the created queries. Please note that you can include data queries based on different universes in the same report.
Combined query: This icon should be used to create a combined query. Combined query is an advanced query that use the union-intersect or minus. Please note that combined query can be tow or more queries. The only restriction here is that combined queries should be from the same universe.
SQL: If you click on the button you will be able to see the SQL code generated by the report engine to be sent to the database engine to retrieve the required data.

Create Query # 2

Left panel


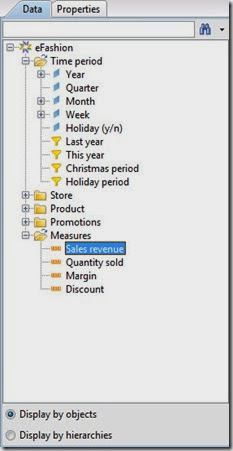
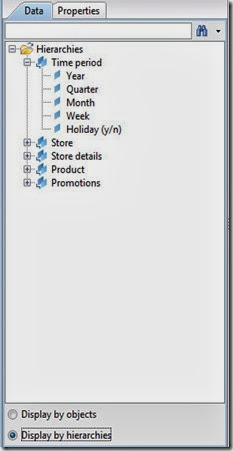
Data Business model: this panel will display a categorized list of all objects available based on the selected universe. You can drag and drop dim measures and filters as well or simply double click on them. You can use search feature to look for a specific object by name. You can change the display for the data by selecting one of the following options from the bottom:

  • Display by object.
  • Display by hierarchy.


DataHier

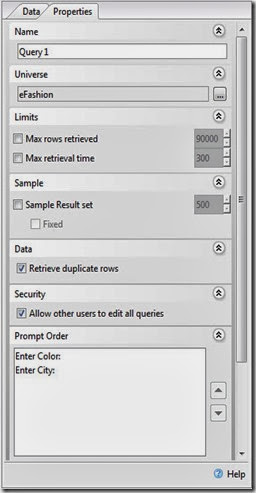
Properties: from the properties panel you can access the following options:

  • Query Name: You can type a meaningful name for your query here. the default query name is “Query#” where # is the current number of created queries in the current report.
  • Universe: You can even change the universe from here.
  • Limits: You can limit the number of records returned by your query by set one of the following options or both: Max rows retrieved or Max retrieval time. Usually we use this option during development time if the number of the returned records is huge. this will help us to test the functionality of the report and to focus on the layout. later one we can disable them when we are on UAT and production stage.
  • Prompt order: You can change the prompt order from here.

 10-22-2013 1-25-32 PM

Right panel

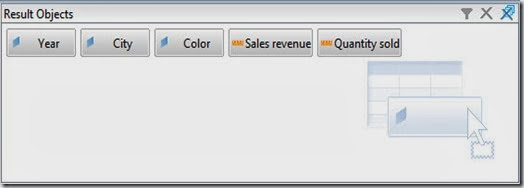
Select Area: Here you can drop your objects that you want them to be part of your analysis.

10-22-2013 1-18-20 PM

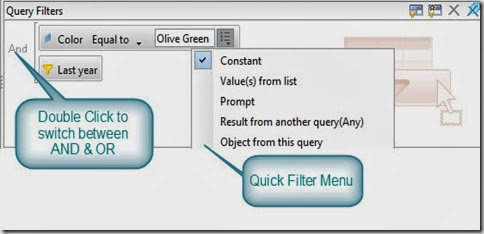
Where Area: Here you should drop your query filter or create them. Pre-defined filters know as conditions are previously created in the universe and you can just drag and use them. on the other hand you can create new customized filter as per your need.

Normal filter will contains the following:

  • Object: The object that you want to filter one
  • Operator: Equal to, greater than, less than,….etc
  • Operand:
    • Constant
    • Value from list
    • Prompt
    • Result from another query(Any)
    • Object from this query


10-22-2013 1-19-06 PM10-22-2013 1-21-50 PM

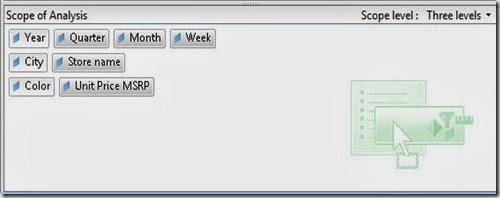
Scope of analysis Area:

In Scope of analysis area you can customize your hierarchy levels to be used in the drill down analysis. for more information about what is scope of analysis please check this link

10-22-2013 1-24-36 PM

Bottom Bar:

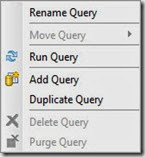
You can manage your queries from the bottom bar. if you right click on this bar you will able to see this menu: You can use this menu to rename query or to run a query, duplicate a query or add a new one.

10-22-2013 1-16-33 PM

You can use the bottom right arrows to navigate or order queries.

4

Friday, October 25, 2013

What is Key Performance Indicators (KPI)?


What dose KPI means?

To say it in a generic way, when you start work on something you should first define your goals. After that you should start trying to achieve your goals. Then from time to time you need to check how far you are from your goals and if your performance on achieving your goals is good or bad. here KPI (key performance indicator) come. The main purpose of KPI is to show how close you are from your goal (some how) but wait!!? normally you will need more than one KPI to indicate how far you are from your goal. to make it more easier let’s take a small example or business case but before that I want to leave one final note before ending my introduction. It is clear now that the KPIs will be different from business to another and from industry to another. yes you may have same goals like increase profit or revenue. but the metrics will be changed. hmmm you should get lost by now, let’s take an example

KPI is a metric used to measure and monitor you performance on achieving your goal(s) and it will give you an indication on your performance

Example # 1:

We have a new web site. there is many income ways implemented in our site. like advertisement, exam registration fees, products sold and so one. first we need to set our goals. I will make it here very simple one. currently our net profit is 10$ and our goal is to make it 50$ by end of the facial year (don’t laugh please :-) !!?).

Goal: Increase net revenue of our web site by 500% in one year.

now we have a goal. it is time to find how to archive it. there is many factor will affect our goals and we need to focus on the important one. we called those factors: Metrics. a metric is usually a number somehow will affect your goal like number of sold products, lets define our metrics here.

Net Profit = net income – net cost

Net income= [# of sold products * unit price]  --- Product income

                   + [# of visitor * AD revenue per view]+[# of add clicks * earn per add click]

                   + [# of scheduled exams * exam fee]   -- Exam Income

Net cost = Fixed monthly site maintenance

             + product processing cost

             + Exam setup

             + …….

Now as you can see, there is some variable metrics and some static ones. for example # of visitor is a dynamic variable metric and monthly site maintenance fee is a static one.  you should concentrate on dynamic one in your KPIs.

now I will use # of visitor as a metric in my first KPI. but first is it enough to have a metric. of course not. you need some how to link this to your goal (achieving 50$ by end of year). to make it more clear check the trend graph below:


image

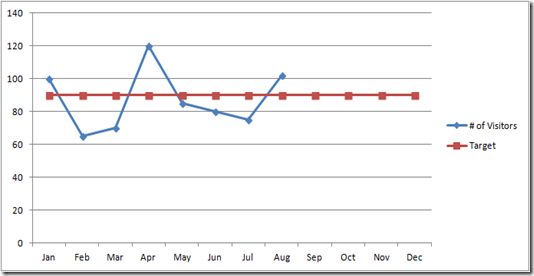
As you can see the graph show you number of visitors per month. but this is not enough to know if those figures are good or bad. is 100 visitor in Jan , 65 visitor in Feb & 70 in Mar means that I will be able to achieve my goal by end of year or not. as you can see metric is just a plain numbers and here all what you can indicate is your trend. by linking your metric to time you could get an idea if your number of visitor are increasing or decreeing over time. And as we already saw in our goal definition we need to increase our visitor in general to get more Ad income. Till now this is just a trend metric and there is something missing.

In order to achieve 50$ lets say that our strategy is to focus on Ad profit this year. if I will keep everything else the same then I should get 10$ by end of year and I have to increase my average number of visitor per month. let say the old average number of visitor of may site was 60 visitor per month. If I got on the average 60 visitor per month and everything else remains the same then we should make 10$ profit by end of year. we need to calculate the new required average number of visitor (Target) assuming that we will not change the remaining factors. hmmmm let’s say that we need on the average 90 visitor per month to achieve our target which somehow will lead to achieve our goal. now the graph should like this:
image

congratulations, we now have our first KPI, as you can see after we added our monthly target which required to be met in order to achieve our goal you can indicate your performance month by month to achieve your goal. We can easily see that we performed well in Jan, Apr and Aug. Nearly achieved our target in may and performed bad in the remaining months. so lets recap what we explained so far.


How to define your KPIs [KPI Definition]:

Define a goal: First you need to define your goals or set of goals. If you have a store then your goals should tell you where you should be? and after how long (when?) 

Define a metric: the next step is define your metric. a metric is a number that will affect your goal

Define a Target: find how your metric should behave in order to achieve your goal. target is the required behavior

Build your KPI: KPI will show how your metric will behave against the pre-set target and will indicates your performance against your target required to achieve your goal

Visual elements used to present KPIs (Charts)

in our previous example we had one measure (# of visitor) and one dimension (Time) and this why we selected the line chart because it is the best visual element to show time trend.

lets now take all the combinations:

Single value KPI: If you have one metric and there is no dimension

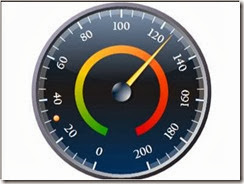
the best way to present single value KPIs is to use one of the following visual element component:
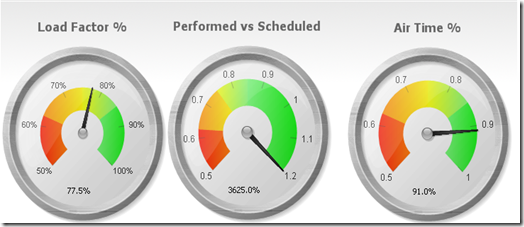
  • Dial
  • Speedometer
  • Gauge

image

Multivalued KPI: if you have more one or more metric or one or more dimension

Case # 1: One metric & one dimension:

This case will depend on your dimension nature. if this dimension is a time dimension then it is preferred to use Line chart as it is the best to show trends. if your dimension is a cyclic one like months during year (12 month) you may use radar chart. if you have only one dimension like region or customer segment then you may use Pie chart or bar chart.


Case # 2: tow metric & one dimension:

in this case you should use the combined chart. it is a combination of line chart and bar chart. the bars will represent one metric and the line will act as the second one. your dimension will be shown in your X axis.


Case # 3: one metric and tow dimensions:

you may use one of the following:

  • bar chart.
  • stacked bar chart.

I will make a special post on type of charts (visual elements) and the suitable use of every one.

Key performance Indicator (KPI) types:

internal:

  • to measure internal performance.
  • not shared with outside the unit
  • The connection to the enterprise business goals in not clear and not strongly mapped to the enterprise goals.
  • still important for tracking productivity and people performance.
  • Example:
    • Response time.
    • Delivery rate.

External:

  • Measure the real metrics which directly related the enterprise main goals.
  • Shared and beaked down into smaller KPIs and been measured on smaller units and departments as well.

Final Note(s)

  • Score Cards: some time you may need to group more than one KPI to measure your goal, this what we call it scorecard. if all KPIs in the score card are equal in weight and contribution to achieve the goal then this is a balanced score card. if KPIs will have different weight then this what we call it unbalanced score card.
  • Key Risk Indicator: KRI is exactly same as KPI. but instead of measuring or indicating performance it is indicating RISK.
  • Indicators: You can use many visual effects to indicate good or bad performance. the traffic light 3 colors is the most know and famous one. but still you can use icons and fond size as well.

References & other links:

Tuesday, October 22, 2013

Condition (Pre-Defined filter) in BO Universe designer

Overview:

It is a best practice to create pre-defined filters (known as conditions) to help end business users to define the required filters in their analysis and reports. for example if we have the following account statuses:

  • N: Normal
  • D: Dormant
  • I: In Active
  • C: Closed

Assume that there is business rule that state the following: active accounts are the accounts which is normal or dormant.

The best practice is to create a pre-defined filter (Active accounts) which will filter only normal and dormant accounts as per the definition. this filter will be available in the business model and the end user can easily select this filter in his/her report or analysis to narrow the report results to only active accounts.

As a best practice, you should define all your business rules during business requirements gathering session. then you need you data analyst to translate it in a technical IT form (usually SQL condition). Then you need to create the corresponding conditions (Pre-defined filters) in the business model at BO universe designer.

How to create a condition (pre-defined filter):

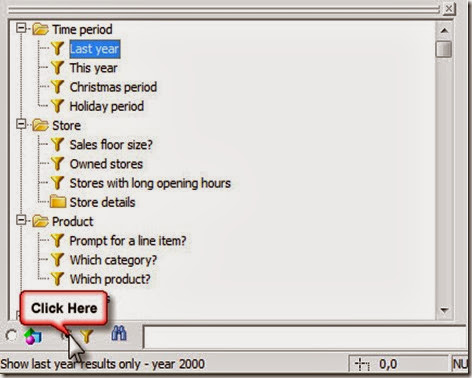
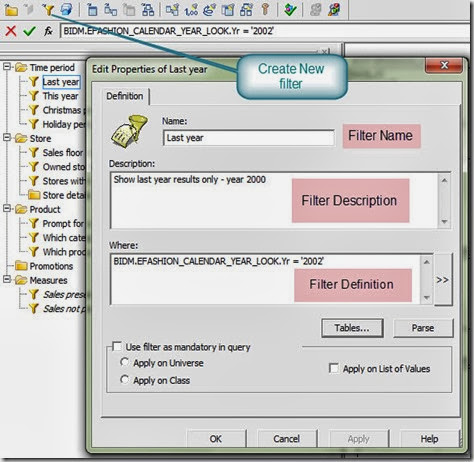
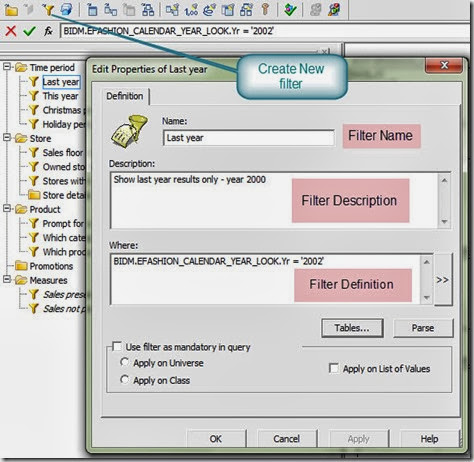
First you need to switch to condition list, then navigate to the folder that you want to create your condition in. this folder should some how related to your condition. for example if you have a product class (folder) and you want to create a condition to filter on electronic products like TVs, Radios…etc. then the product folder is the best place to create that condition. click on the condition icon (yellow cone) and then follow the steps in the following section to define your condition

10-22-2013 2-03-11 PM


what you need to define you condition (pre-defined filter):

Condition Name: this name should be descriptive and in business terms. For the earlier active account example. we named our filter active account because this describe the business rule clearly.

Condition description: You should write a description here about this filter, when to use it. what you expect when you use it.

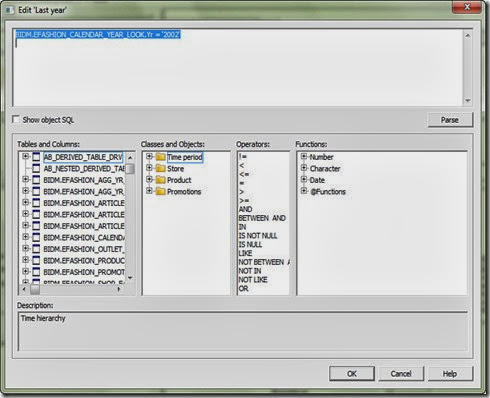
Condition where: this should contains the technical SQL statement generated by the data analysis for the business rules. you can use the formula editor for more complex conditions.

 10-22-2013 1-51-15 PM

Formula Editor:

10-22-2013 2-04-34 PM

Mandatory filters:

You can site your condition to be used as a mandatory filter in your universe or class by ticking the following option while creating your condition:

Use filter as mandatory in query:
Apply on universe: filter will be applied on every query generated using this universe.
apply on class: filter will be applied if any object used from the current class.
apply on list of values: filter will be applied on all LOV (list of values) generated for each object inside this class (folder). Please note that this option available only after you select apply on class

 10-22-2013 1-51-15 PM

Types of conditions:

  • filters: it doesn’t need any input from the user. it will apply the criteria impeded inside this condition when dragged to the query filter.
  • Prompt: It will ask the end user for his input to apply the filet.

Monday, October 21, 2013

What is Micro Cube in SAP Business Objects


When you create data query in SAP business Objects the data retrieved and stored in a Micro cube, known also as Webi micro cube. This Micro Cube is stored along with the report and the report size will vary based on the saved micro cube size. BO reporting engine will use this microcube to display data on the report based on the selected objects and based on the aggregation function associated with each measure. to reduce the micro cube size you need to assign database aggregation function on each measure. This will submit a grouped by query to the data base and it will reduce the micro cube size and it will enhance the overall report performance.

You can set 2 aggregation level on universe measure

Database level: used as an aggregation function applied on the measure when submitting the query to the database. if you query is against a detailed table the grouped by query will retrieve less number of rows rather than the normal query. This will lead also to a smaller micro cube size.

Report level : we can set this property from object properties tab. if we set the object qualification to be measure we will be able to set the aggregation method from the properties tab. this function will be used only in the report level on top of micro cube data to display data on the report.

Sunday, October 20, 2013

Derived Table in SAP Business Objects Universe Designer


Overview:

Derived table is one of the features provide by SAP business objects universe designer. It is a logical table created on the semantic layer level [Universe] and will be executed at run time. This is different from physical table as physical table store data and can be manipulated by DDL and transactional statement. While in Derived table it acts like database view.


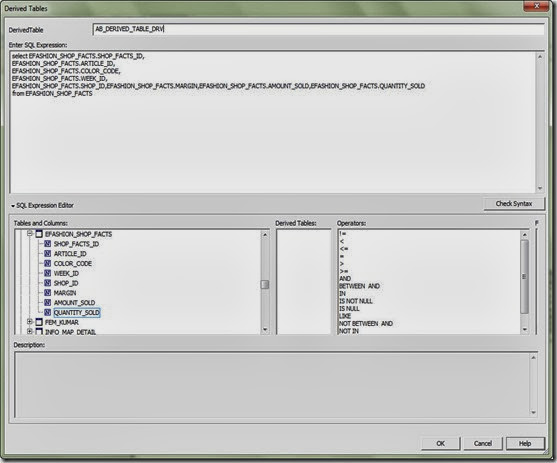
How to create and implement Derived tables:

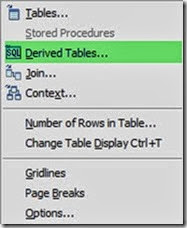
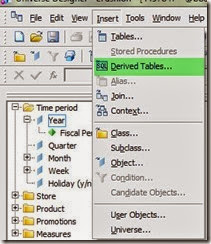
  • Open universe designer and right click on any empty space in the right ban (physical layer) OR go to insert menu and select derived table
  • Type a proper name for your derived table.
  • Write the SQL select statement that will be used to define your derived table in: “Enter SQL Expression Area”
  • You can use “Table & Columns” panel in the bottom left corner to make it easier for you when selecting the required column in your derived table definition.
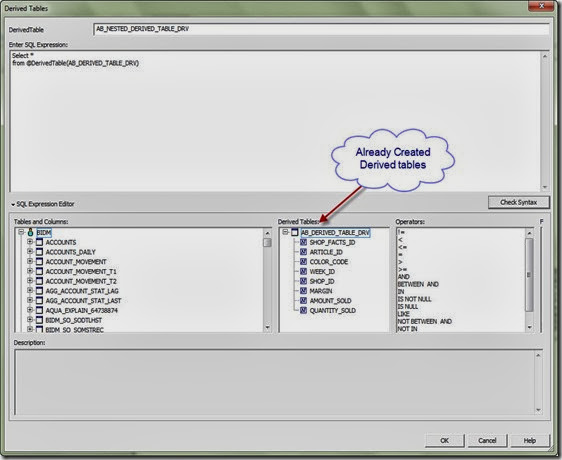
  • You can select a derived table from derived table panel to create a nested derived table.
  • You can select the required operator from the operator panel in your calculated fields.
  • Check syntax of your derived table definition and resolve SQL errors if any.
  • Click ok to complete your derived table.
  • Now you will be able to see your derived table in the physical layer and you can start use it as a normal table (Join, Create objects,…etc)

Derived table Rclick

Derived table Insert Menu


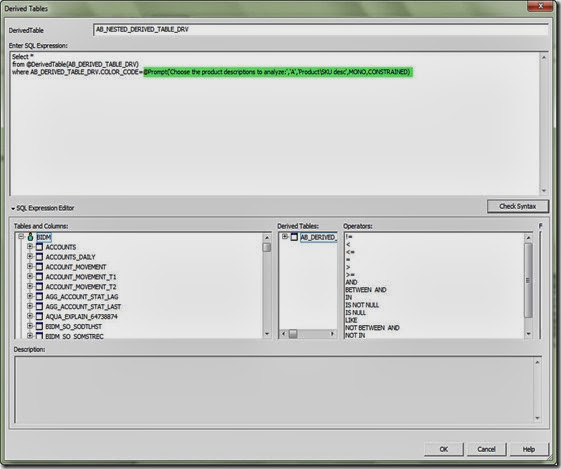
Using Prompt in derived table:

You can use a prompt in the definition of derived table. When you use any object related to this derived table it will prompt the end user to enter the required values. You can use prompt in the where clause as well as in calculated column definition.


Nested Derived Table:

Nested derived table is a derived table created on top of another derived table. This is a new feature in BO XI 3.0 and onward. You will use one derived table to define the other one. Normally we use nested derived tables if we want to simplify the design when have a very complex business logic. In that case we will build small derived tables and we will start using them in the bigger one. Please note that you can create as many derived tables as you wish but you only allowed to nest up to 20 level of derived table.


List of derived tables:

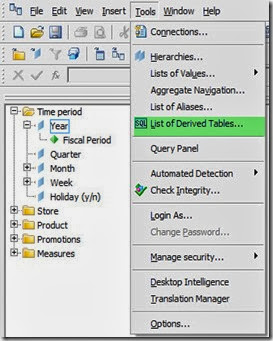
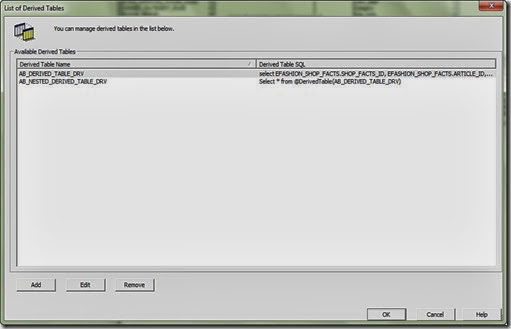
for very large universe it will be impossible to manage your derived tables if you don’t have a centralized place to access them. List of derived table window will give you that function. to access it click on tools menu, then select “List of derived tables…”. you can edit remove or add derived tables from that window.

Tools list of derived table

List of Derived tables


Derived table best practice, advantages & disadvantages:

  • Write your derived table name in capital letters and without spaces. You can use “_” as a separator between words. Example: AB_EXAMPLE_TABLE_DRV
  • Use “_DRV” as a suffix to your derived table name to segregate between derived tables and other tables (Aliases & physical tables)
  • If you have a permission to create a DB view, then it is better to use it and imported to your physical layer.
  • Use derived tables in the following cases:
    • If you need to use a prompt inside your table.
    • If you have a complex logic to be implemented and you can do it from report level.
    • If you have one big lookup table and you want to create specific mini lookups.
  • Always check syntax before creating derived table.
  • Give calculated columns a meaningful name as it will be displayed in the table view.
  • Use nested derived tables when you have very complex business logic. This will make your universe more readable and understandable by other developers.
  • You may encounter a bad performance when using derived table as it is a logical table and there is no data stored in it. You can create an index or adjust table space or do any performance enhancement on your derived table. But on the other hand you can be carful by optimizing the performance for the SQL select statement used in the derived table definition.
  • Add SQL comments in the definition of your derived table to explain your derived table and make it easier for other developers to know why this derived table was created. You can also describe business logic and column definition.
  • Remember this constrain: Nesting derived table is limited to 20 level .

Derived Table Examples:

Derived table:

Drived Table # 1

Nested Derived Table:

Nested Derived table

Derived table with prompt:

Prompt in Derived Table

Friday, October 11, 2013

What is a Dashboard?

Overview:

Before we start define Dashboard we need first to explain the following:

  • Indicator
  • KPI
  • KRI
  • Score Card
  • Report
  • Dashboard

Indicator:

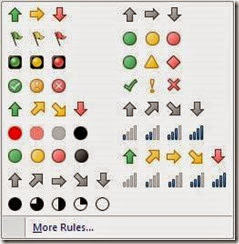
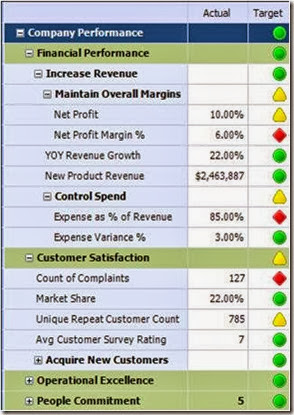
Indicator is some visual effects that can give you extra information not included in the original figure.  for example lets say that our profit this month is 10$. as you can see, you can’t judge if this number is good or bad. 10$ so what? if we have another piece of information like target for example or average profit for the last 12 months then we can judge if 10$ is good or bad. there is many type of indicators like

  • Traffic light colors: (red, Yellow, green)
  • Icons:
    • arrows: Up – side – down
    • Faces: smiley – normal – sad
    • progress bars

Note(s):

  • You can use more than one indicator at a time.
  • you can use more levels than 3. for example 5 colors (red – orange – yellow – light green – dark green)

Picture1


KPI (Key Performance Indicator):

The main idea of KPI is to measure your actual performance figures against your target. so normal KPI should have at least:

  • Actual figure
  • Target Figure.
  • Indicator
  • Mechanism to display (Chart)

KPI used mainly to measure performance and should give immediate impression about your status. we use indicators to indicate if we are meeting our target or not.Please note that KPI can be any chart type, Find below some examples:

Picture2

KRI (Key Risk Indicator):

KRI is almost same as KPI but only with a few differences:

Feature KPI KRI
Measuring Performance Risk
Against Target threshold

In many cases you need to incorporate an alerting system with KRI to send it immediately by mail or a warning SMS message to risk owner because in most cases you want to act immediately when the risk is triggered.

Score Card:

Score card is a group of related KPIs that will contributes to achieve one big goal. there is 2 types of score cards.

Balanced: this an equal weight score card whish means that every KPI under this goal have the same importance. and when you calculate your achievement % for your goal you Just take the average.

Not Balanced: every KPI under the enterprise goal will have his own weight. the some of all weights should be 100% at the end. and when you calculate your achievement % for your goal you should consider the weights

Picture3

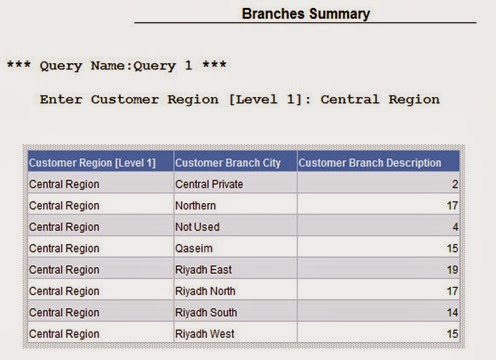
Report:

Summary or detailed information displayed in tales or charts.

Branch Summary Report

10-10-2013 3-10-09 PM

Dashboard:

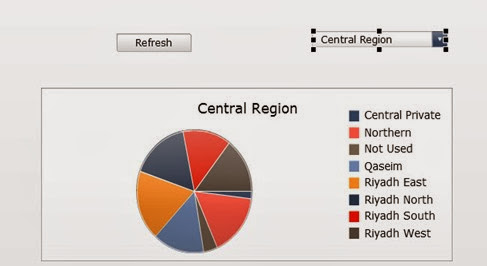
Dashboard is a container or view that contains any number of the components listed above. typical dashboard should be customized per business user while many customized dashboards may consume the same component. for example you may have KPI used in many dashboards. Dashboard can contains KPI, KRI, Score cards and reports.

Picture4

Thursday, October 10, 2013

Dynamic refresh for Dashboard content using Live office Connection


Overview:

In this post we will find how to dynamically refresh SAP dashboard [formerly know xcelsuise ]content using live office connection. Simply we will do the following:

  • Create Webi (Web Intelligence) report with prompted parameter.
  • Link our excel file with Webi report data using live office.
  • Link (bind) report parameter to excel cell. When the value of this cell changed the new value will be passed as a parameter for that report.
  • Import this excel file to be our dashboard data source.
  • Open data manager and use live office connection stored in excel.
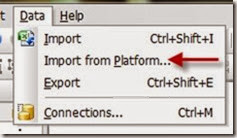
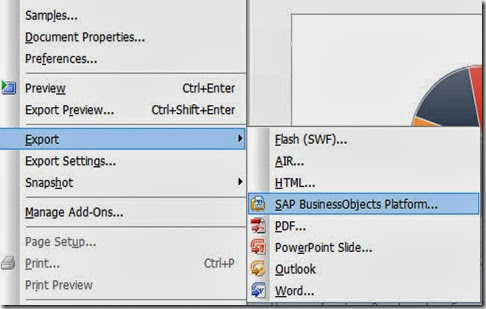
  • Export our dashboard and refresh it automatically from info view.

Step # 1: Create a report:

By the way you can use live office to retrieve data from SAP BO using one of the following:

  • Crystal Report.
  • Web intelligence report (Webi Report)
  • Universe.

In this post I will guide you through the second option which is using web intelligence report as a source for our data and information. You can build your report using InfoView or rich client. So lets start:

We want to create a simple report to display branch summary information. The report should prompt the end user to select a region and the report will display the number branches under this region. Find below the report specification and screen shot for the final output.

  • Report name: Branches by region
  • Report Information:Region – City - No of Branches
  • Report Prompt: Select Region code:

After we completed our report we will save it and export it to our repository.

Figure # 1

Branch Summary Report

Figure # 2

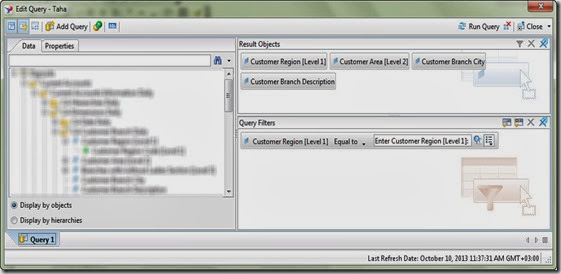
Edit Query

Dashboard Prompt

Step # 2: Create Excel file with live office connection:

  • Create a new excel file then navigate to Live Office tab [make sure that you already installed live office plug in].
  • Then insert data from web intelligence report that we already created.
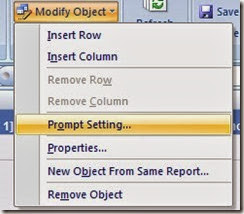
  • Select Modify object from Live Office tab
  • Select Prompt setting
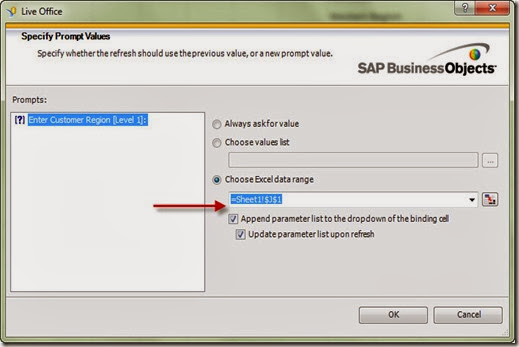
  • Select the 3rd choice:
    • Always ask for value.
    • Choose values list
    • Choose excel data range. [Select This one and select the cell that you want to bind your prompt with.]
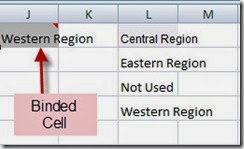
  • Now we have successfully bind our report prompt with a specific excel cell. Whenever data changed in that cell it will be passed automatically to the report and it will retrieve the refreshed data.
  • Finally, Save your excel file to BO repository by selecting Save to BOE option from live office tab.

Figure # 3

Live Office

Figure # 4

10-10-2013 11-52-59 AM

Figure # 5

10-10-2013 11-53-20 AM

Figure # 6

10-10-2013 12-10-56 PM

Step # 3: Create Dashboard:

  • Open SAP dashboard designer
  • Import previously saved excel file from BOE to be our data source.
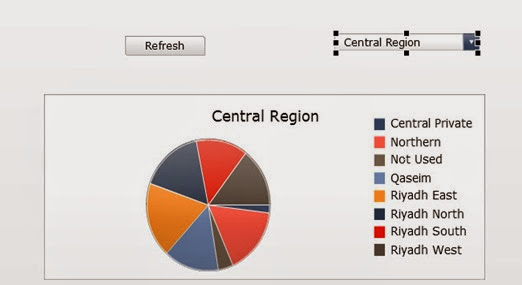
  • Build a pie chart on top of the summary table.
  • Create a drop down menu selector to display regions and set the insertion target to the blinded cell (gray one)
  • Open data connectivity manager and select live office.
  • Configure it to run after data been changed in the blinded cell.
  • Save dashboard to enterprise server.

Figure # 7

10-10-2013 2-35-15 PM

Figure # 8

10-10-2013 3-12-19 PM

Step # 4: Access Dashboard and refresh data from info view:

  • Access saved dashboard from info view.
  • Select another region from the drop down menu selector.
  • See the data been refreshed.
    10-10-2013 3-10-09 PM

Friday, October 4, 2013

BO Universe Connection


Overview:

This post is created to guide you on how to create and modify data connections in business objects universe designer. please note that you can create one data connection per universe BOXI3.1 and backward. While you can create multiple connection in BO4.


How to access BO universe connection:

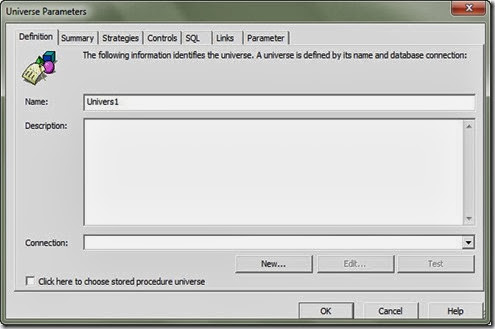
Click on universe parameters icon from universe designer tool bar or from file menu. Then navigate to Definition tab, You can select one of the pre-defined connection or simply you can create a new one.

Universe-Parameters-Definition_thumb

Find below a step by step work through to create your new connection:

To create new connection you should open universe parameters and click on new connection button from definition tab. Or you can so the same by open Tools Menu --> Connection ,Then follow the wizard screen described below:

Screen # 1: Welcome Screen

This screen will display a welcome message and description about what this wizard will going to implement.

[Click Next]

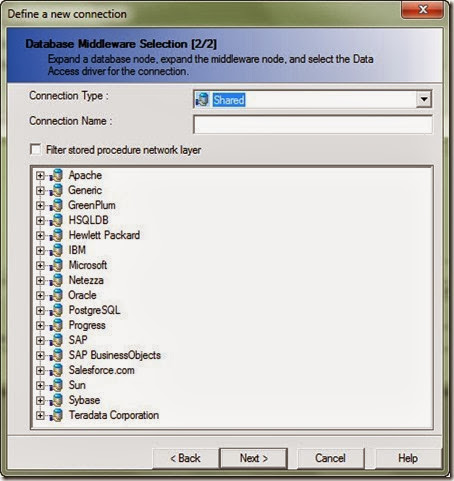
Screen # 2: Database Middleware Selection

We need to select connection type, select a connection name and finally data access driver

Connection Types:

Personal: Can be used only by you and only on your machine.

Shared: Can be shared with multiple users. But not stored on BO repository and can’t be accessed by the enterprise.

Secured: Save on BO repository and can be accessed by all users across the enterprise based on the security assigned.

Data Access Drivers:

Here you will find almost all famous database vendors. You can select a vendor to expand supported version & releases under that vendor. For example if you expand (+) beside oracle you will be able to select one of the following oracle releases (Hyperion Essbase 7.0, Hyperion Essbase 9.0, Oracle 10, Oracle 11 & Oracle 9 )

There are a couple of things that I want to highlight regarding data access drivers:

  • There is tow SAP data access drivers, one for SAP Business Warehouse & SAP BusinessObjects. Under SAP Business Objects , you will find many of SAP product that you can directly connect to. Like SAP Strategy Management, SAP Business Planning & Consolidation…etc
  • You can select ODBC, JDBC or text file data access driver from generic vendor group.

[Select Connection Type] --> [Type connection Name] --> [Select proper Data access driver]

Please note the following screens will depend of the data access driver that you have selected as the configuration will vary from driver to another.

Connection--1_thumb1 

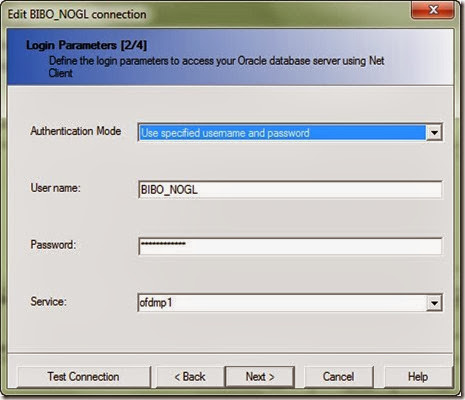
Screen # 3: Login Parameters

In this screen you should enter the authentication information. In case of you selected oracle client as data access driver you will be prompted to enter:

  • Service Name
  • Authentication Mode:
    • Use business object credential mapping
    • Use single sign on when refreshing report at view time.
    • Use a specific user name & password.
  • User Name:
  • Password:

Please note:

  • The configuration listed in Screen # 3 above assuming that you have selected oracle client as data access driver. Other data access drivers may have different configuration with different names.
  • User name & password will be displayed if you have selected “use specific user name & password” as authentication mode.
  • You should test connection before you proceed.

Login-Parameters_thumb1

Screen # 4: Configuration Parameters

From this screen you can set the advanced data access driver configuration. For now just leave it as default. Then click finish to close the create new connection wizard.


References:

Universe Parameters - ANSI92

Overview:

This is one of universe designer SQL generation parameters. The main use of this parameter is to enable/ disable ANSI92. This means that the SQL generated code from the report query will be in ANSI92 format if this parameter is enabled (Yes) other wise it will follow the old SQL ANSI89 standards. before we start we need to know what is the difference between ANSI92 & ANSI89

ANSI92 Vs. ANSI89

Both of them are SQL standers. Most people are familiar with the old ANSI89 one because it require less type effort. While ANSI92 introduced many new data types and a lot of enhancement on the syntax especially on joining table part. ANSI92 code should be more readable and less chance to encounter errors. One of the most attractive changes is to isolate table joining part from where clause.

ANSI89 sample SQL statement:

SELECT DISTINCT
  BIDM.RB_DM_CLM_TRANSACTIONS.AS_OF_MONTH,
  TRANS_COA_HIER.LEAF_DESCRIPTION
FROM
  BIDM.RB_DM_CLM_TRANSACTIONS,
  OFDM.OFS_RPT_COA_HIER  TRANS_COA_HIER
WHERE
  ( BIDM.RB_DM_CLM_TRANSACTIONS.COMMON_COA_ID=TRANS_COA_HIER.COMMON_COA_ID(+)  )

ANSI92 Sample SQL Statement:

SELECT DISTINCT
  BIDM.RB_DM_CLM_TRANSACTIONS.AS_OF_MONTH,
  TRANS_COA_HIER.LEAF_DESCRIPTION
FROM
  OFDM.OFS_RPT_COA_HIER  TRANS_COA_HIER RIGHT OUTER JOIN BIDM.RB_DM_CLM_TRANSACTIONS ON (BIDM.RB_DM_CLM_TRANSACTIONS.COMMON_COA_ID=TRANS_COA_HIER.COMMON_COA_ID)

Note(s):

  • As you can see in old ANSI format we have used the (=) to represent Join and (+) to represent outer join.
  • In ANSI92 we used (RIUGHT OUTER JOIN) and (ON) operator to represent table join. as you can see it is more readable and clean but on the other hand you need to type more code.

Parameter definition:

As per SAP user guide, you will find the following definition:

Parameter Name:

ANSI92

Parameter Possible Values:

Yes/ No

Default Value:

No

Description:

Specifies whether the SQL generated complies to the
ANSI92 standard.

Parameter Value = Yes:

Enables the SQL generation compliant to ANSI92
standard.

Parameter Value = No:

SQL generation behaves according to the PRM parameter OUTER_JOIN_GENERATION


How to set this parameter:

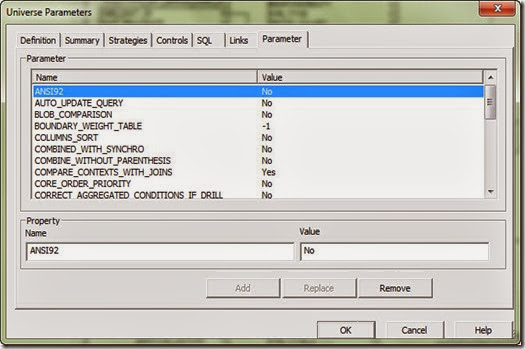
  1. Open Universe parameters by click on the corresponding icon or from file menu.
  2. Navigate to Parameter tab (Last tab)
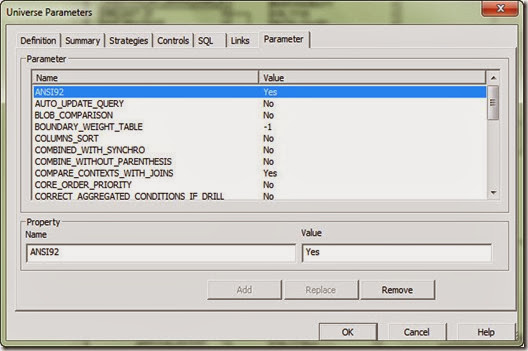
  3. You will find a screen as shown below. You can select the required parameter from the upper panel and the parameter name and current value will be displayed on the bottom.
  4. You have 3 buttons:
    1. Add: if you want to add new parameter.
    2. Replace: Edit the current value for the selected parameter with the new entered one.
    3. Remove: Delete that parameter

Figures:

Default ANSI92 parameter setting:

ANSI92 No

After changing it to Yes.

ANSI92 Yes

References: